Understand your travel CO2 impact
- Plane, car or train, what's the difference?
Travel CO2
Compare travel & accommodation CO2
Compare the carbon impact from business trips, conferences and vacation travel. Easily include emissions from hotels and airport transfer.
Transparent scientific emission data
Our climate data is based on fully transparent methodology developed by independent researchers at Swedish universities.
Visualize relevant climate impacts
See the climate data relevant to your organization. Analyze the impact using any of our customizable charts.
Visitor Travel CO2 Surveys
How do visitors travel to you and how big is the climate impact? All you need to do is ask.
Use the Travel CO2 Surveys to ask visitors how they travel and automatically calculate carbon emissions for CSRD reporting.
Trusted by
KTH Skitouring Scandinavia Sveriges Bussföretag Ernst & Young Göteborgs Universitet Klimatsmart Semester RISE - Research Institute of Sweden
Emission Calculators
for all kinds of travel
Compare travel modes, vehicles and fuels in our smart CO2 calculators.
We create custom travel emission calculators for businesses, researchers and NGOs. Or you can use our easy-to-embed standard calculator on your website immediately.

This is one of our simplest carbon calculators, try it!
impact visualizations
made smart & simple
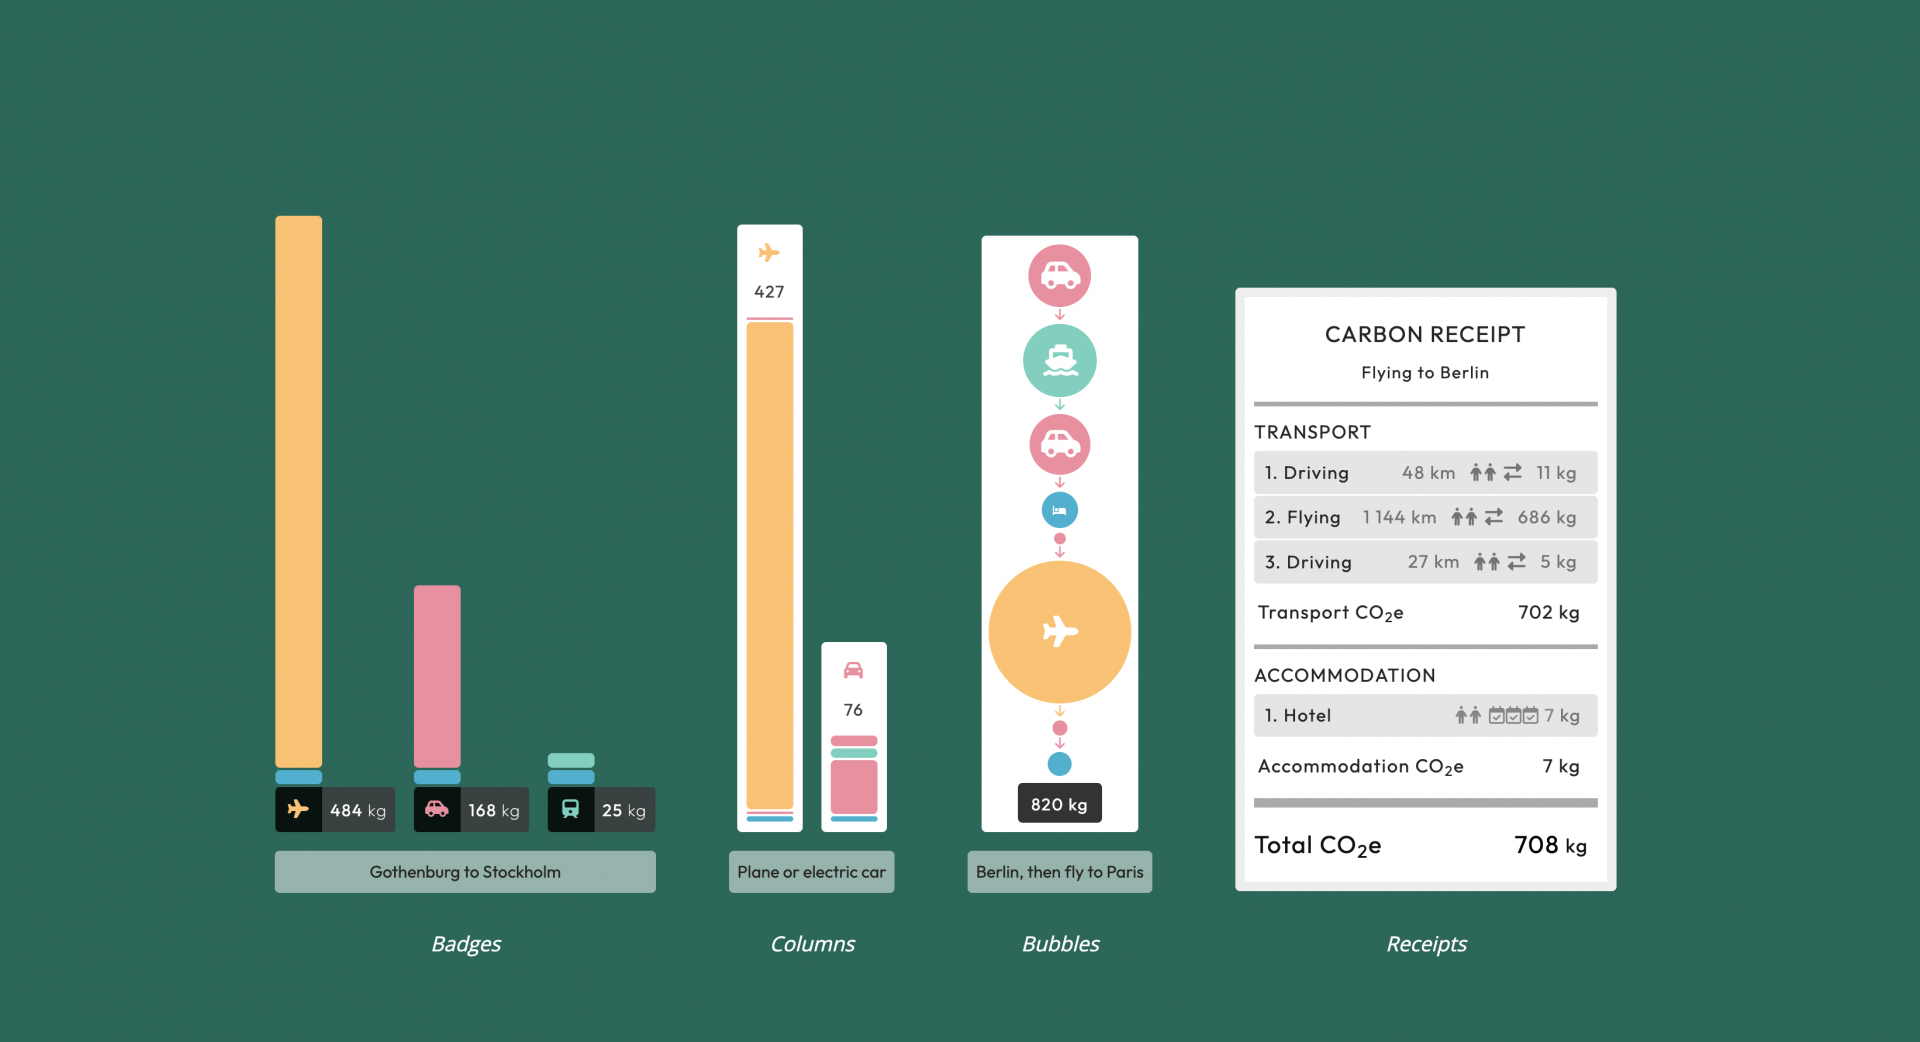
Display complex carbon emissions in ways that are easy to understand.
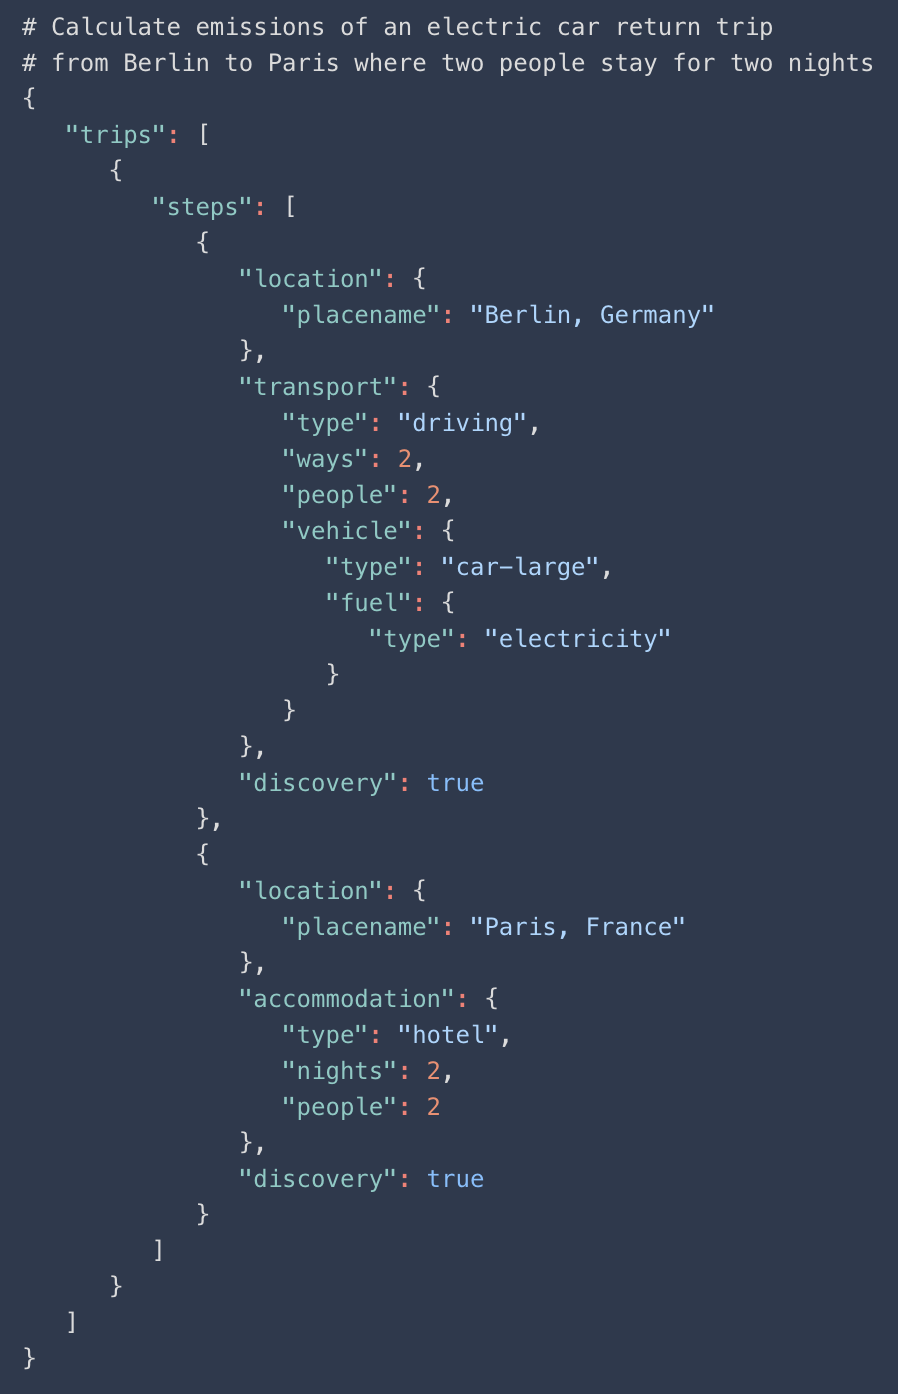
Here are a few examples of our interactive visualization widgets. You can create charts, receipts and other visualizations instantly by using our calculator or the API. We create custom visualizations on demand.

Columns


Receipts


Badges


Carbon labels
create confidence
A carbon labelling system for travel agencies and tour operators.
Find customer loyalty and trust through transparent climate information. We provide a user friendly tool where you can create carbon labels for websites, print and other media.
Color scale for comparisons
The color scale is a comparison with the emissions of typical long-distance trips.
Emissions per kilometer
To facilitate comparisons, an average of the entire trip's emissions per person kilometer is shown.
Information about the label
The title of the trip, the company's name and the unique ID of the label are shown.
Emissions by mode of transport & type of accommodation
Click on the icons for more detailed information about the vehicle, fuel, route and accommodation.
QR code
The QR code is a link to more information about the trip and the label. Try clicking or scanning!
BY DEVELOPERS, FOR DEVELOPERS
Build flexible applications
Create business applications with intelligent carbon data for any kind of travel. Help your customers measure, report and reduce their carbon footprint.

Check out the API documentation and sign up for API Access to get started with data integrations.

Want to
know more?
Do you have questions about our API or want to know more about how to use our services? Need help integrating carbon emission data into your application?

We provide free tech-support to all customers and make sure you can follow through with your API implementation. Contact us to get started.